

Laser powder bed fusion (LPBF) additive manufacturing is a laser 3D metal printing technology that is being widely explored in both industry and academia for the production of metal parts with reduced material waste and improved design flexibility. However, the presence of porosity is an Achilles' heel in LPBF under high laser energies. How do those pores form and can we minimise the porosity? Keyhole porosity is a key concern in LPBF, as it potentially impacts the working lifetime of the component. During laser powder bed fusion 3D printing, a sunken area, known as a keyhole, frequently forms, which is caused by recoil pressure created by vapours. Keyhole dynamics are very complex and difficult to predict because of its dependence upon many physical mechanisms. However, it is very important to be able to quantify the occurrence of keyholes’ collapse because it is highly related to defect formation in metal 3D printing. However, when the laser melts the powder/substrate, it can form a vapour cavity which can oscillate and collapse, forming pores which may degrade properties. Scientists at the Research Complex at Harwell, UCL, STFC, Queen’s University and the Argonne National Laboratory have collaborated to capture the keyhole fluctuation, collapse, bubble growth and shrinkage using ultra-fast synchrotron X-ray imaging. The results are providing new insights to guide the future development of 3D printed metals with reduced porosity.
Researchers combined their previous in situ synchrotron X-ray imaging results from LPBF of an aluminium alloy (Al7A77) with recent studies of other key additive manufacturing alloys (Ti alloys and Steel). They found a transition regime between the stable and unstable keyhole regimes. The vapour depression becomes unstable, randomly collapsing and inducing pores at the middle of the rear keyhole wall, as opposed to at the bottom of the keyhole, which is the traditionally observed location for pore formation. They also observed significant trends in keyhole fluctuation frequency across the different keyhole regimes. Based on their observations, the team developed a material, machine and process condition agnostic relationship for the front keyhole wall angle, which collapses to a single function of the normalised enthalpy product. The resulting relation provides a non-dimensional threshold for predicting the three keyhole regime transitions and the onset of keyhole porosity for different alloys and processing conditions (e.g., laser spot size, laser power, laser scan velocity).
Their findings have therefore revealed that keyhole porosity can initiate not only in unstable conditions but also in the transition keyhole regimes created by high laser power-velocity conditions. This causes fast radial keyhole fluctuations and has helped pinpoint when and where transition regime collapse occurs. Immediately after keyhole collapse, bubbles undergo rapid growth due to pressure equilibration, then shrink due to metal-vapour condensation. Concurrent with condensation, hydrogen diffusion into the bubble slows the shrinkage and stabilises the bubble size. The keyhole fluctuation and bubble evolution mechanisms revealed may guide the development of control systems for minimising porosity.
Yuze Huang, Tristan G. Fleming, Samuel J. Clark, Sebastian Marussi, Kamel Fezzaa, Jeyan Thiyagalingam, Chu Lun Alex Leung & Peter D. Lee, Keyhole fluctuation and pore formation mechanisms during laser powder bed fusion additive manufacturing, Nature Communications (2022).
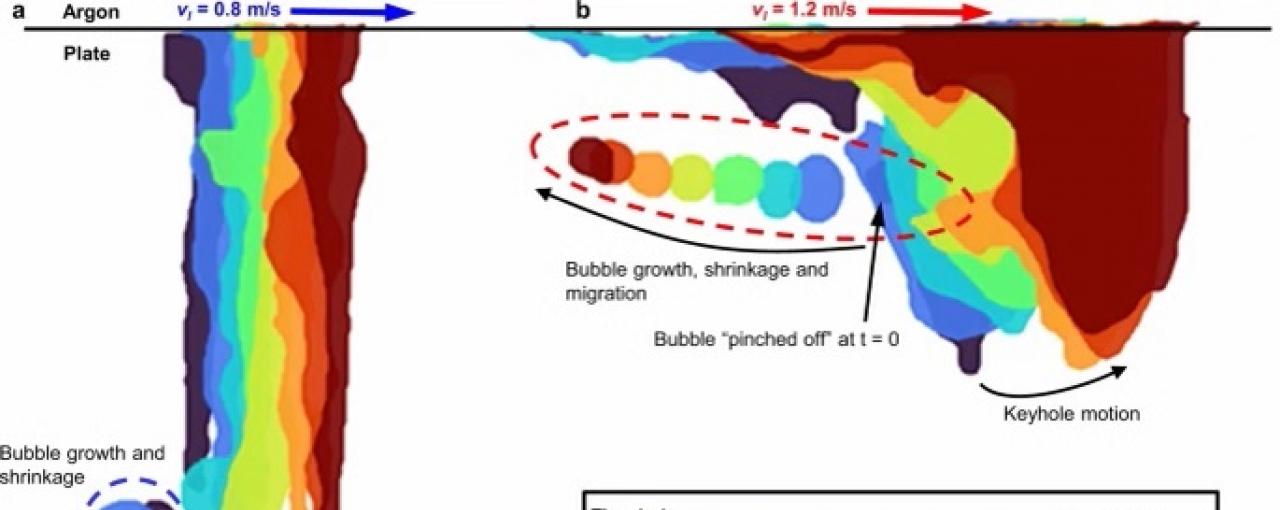
Image - Fig 4: Colour map tracking for keyhole and bubble under low a and high b laser scan velocities, corresponding to regimes (III) and (II), respectively. Comparing the modelled bubble size variations with in situ X-ray measurements at low c and high d laser scan velocities. The equivalent diameter is calculated using 6A/π−−−−−√6A/π, where AA is the bubble area measured from X-ray image (see the “Methods” section). The bubble size error is calculated as ±2 pixels (1.96 µm/pixel), equivalent to the segmentation uncertainty. Note, the bubble shown in a split into two small ones in the later stage, where the equivalent diameter is estimated based on their sum area in (c). The temporal resolution of X-ray imaging (20 µs) is insufficient to capture the whole process of bubble growth, therefore, we are unable to get enough data and fully verify the bubble growth model. e Bubble migration distance compared to their initial formed location. The bubble migration distance error is calculated based on the bubble motion with instantaneous speeds (0–5 m/s) during the finite camera exposure time (2.5 µs). Low laser scan velocity 0.8 m/s, high scan velocity 1.2 m/s, laser power 500 W. The time 0 is set when a bubble first appears.